-
PDF
- Split View
-
Views
-
Cite
Cite
J Alan Erickson, Ryan A Jensen, David G Grenache, Performance Evaluation of an ELISA for the Quantitative Measurement of α1-Antitrypsin in Stool, The Journal of Applied Laboratory Medicine, Volume 1, Issue 1, 1 July 2016, Pages 60–66, https://doi.org/10.1373/jalm.2016.020198
Close - Share Icon Share
Abstract
The diagnosis of protein-losing enteropathy is aided by the measurement of α1-antitrypsin (A1A) in stool and serum to calculate A1A clearance. The objective of this study was to determine the performance characteristics of an ELISA for the measurement of A1A in stool and to determine reference limits for stool A1A and A1A clearance.
A1A in stool was measured with a polyclonal antibody-based ELISA. Assay imprecision, analytical sensitivity, linearity, accuracy, analyte stability, and reference intervals were determined.
Within-run and total CVs were 5.4% and 6.5% and 13.8% and 14.5% at 17.3 and 66.9 ng/mL, respectively. The limit of quantification was 2.0 ng/mL, and the assay was linear to 85 ng/mL. Mean recovery of A1A added to samples was 108.2%. A1A was stable in stool for a minimum of 2 days, 7 days, and 3 months at room temperature, 4–8 °C and −20 °C, respectively. The upper 95th percentile reference limits for A1A in stool and A1A clearance were 0.48 mg/g and 49 mL/day, respectively.
The A1A ELISA demonstrates acceptable performance for quantifying A1A in stool. The assay can be used in conjunction with serum A1A measurements for determining A1A clearance.
Evidence presented on the analytical performance of a stool A1A test will allow better characterization of protein-losing enteropathy.
α1-Antitrypsin (A1A)4 is a serum protease inhibitor that inactivates a wide range of proteases (1). Because A1A resists degradation by digestive enzymes, the measurement of A1A in stool can be used to detect the presence of serum proteins in the gastrointestinal tract (2–4), a sign of protein-losing enteropathy (PLE). The major causes of PLE can be divided into erosive and nonerosive gastrointestinal disorders, as well as increased central venous pressure or mesenteric lymphatic obstruction (5). Among such disorders are enteritis, Crohn disease, ulcerative colitis, and celiac disease (6–9).
The recommended test for diagnosing PLE is A1A clearance that is calculated using measurements in serum and a timed stool collection (2, 3, 7–10). In the absence of a timed stool specimen, the A1A concentration in a random stool can be used as an alternative, but is less preferred (11, 12).
Because A1A concentrations in serum are normally severalfold greater than those found in stool, the testing methods are generally optimized to measure concentrations in serum rather than other sample types. The objective of this study was to determine the performance characteristics of a polyclonal antibody–based A1A ELISA designed for measurement in stool and to determine A1A reference limits for stool and clearance.
Materials and Methods
Samples
The use of residual stool specimens sent to the Associated Regional and University Pathologists (ARUP) laboratories for fecal A1A testing, as well as paired sera and timed stool samples obtained from healthy volunteers, were approved by the University of Utah Internal Review Board. Stool specimens were stored for <48 h at refrigerated temperatures or at −20 °C for longer storage. Stool extracts and reference sera were stored at −20 °C until testing.
A1A measurements
For use in clearance calculations, serum A1A was measured using the Tina-Quant immunoturbidimetric A1A assay (Roche Diagnostics) on the Roche cobas® 8000 modular system. This assay has a total imprecision CV of ≤5.1% at concentrations of 77, 141, and 204 mg/dL and an analytical measuring range of 20–600 mg/dL.
Stool A1A ELISA performance evaluation
Assay imprecision was evaluated using 10 separate extracts made from each of two stool specimens containing different A1A concentrations. Separate extracts were used to evaluate the imprecision introduced by the stool extraction step. Each extract was stored at −20 °C until testing, for a maximum of 29 days. Imprecision was assessed over 10 runs (one run per day), with each sample tested in five replicates at each run. Allowable total imprecision was defined as ≤15%. Limit of blank (LoB) was determined from 23 replicate measurements of the zero calibrator and a stool extract with an A1A concentration of approximately 2 ng/mL. LoB was defined as the mean + 2 SD of A1A concentration of the zero calibrator. The limit of quantification was defined as the lowest concentration of A1A that produced a CV of <20%. Assay linearity was assessed by diluting a stool extract with a high A1A concentration with wash buffer to produce seven samples that spanned an expected A1A concentration range of 3.5–84.8 ng/mL. Samples were tested in duplicate in a single run. Allowable nonlinearity was defined as 10% across the measuring range. Accuracy was evaluated by recovery studies performed by adding known concentrations of A1A (from diluted serum) to aliquots of four extracted stool samples, each with a different concentration. Each extracted stool sample was spiked with three different quantities of serum A1A (n = 12 recovery samples) and tested in duplicate in a single run. Allowable difference in recovery was defined as 90%–110%. A1A stability in stool was assessed at two concentrations by allowing stool aliquots with known A1A concentrations to remain at room temperature for 2 days; at 4–8 °C for 1, 2, 3, and 7 days; and at −20 °C for 1, 2, and 3 months. After the allotted time had elapsed for each sample, A1A was extracted and stored at −20 °C for a maximum of 19 days before testing in duplicate. Additionally, A1A stability in stool extracts stored at −20 °C was determined at two concentrations by storing extract aliquots for 2 and 6 months.
A1A reference intervals
Reference intervals for stool A1A and A1A clearance were established using timed stool samples and sera collected from 124 healthy volunteers (62 males, 62 females; ages 19–61 years). The limits were determined by nonparametric analysis at the 95th percentile. Blood was collected from each volunteer at the initiation of the stool collection period, and the serum was separated within 2 h of collection. Each volunteer was provided a timed stool collection kit and instructed to collect all evacuated stool for 24 h. If no stool was obtained in 24 h, the collection interval was extended to 48 or 72 h, whichever was shorter. Collection kits were stored at refrigerated temperatures during the collection period. On return, the collection interval and stool mass were recorded, the sample was homogenized, and an aliquot was removed for A1A testing.
A1A clearance
Data analysis
Data analysis was performed using Microsoft® Office Excel (Microsoft Corporation), GraphPad Prism® (GraphPad Software), and StatisPro™ method evaluation software (Clinical and Laboratory Standards Institute).
Results
Stool A1A ELISA performance evaluation
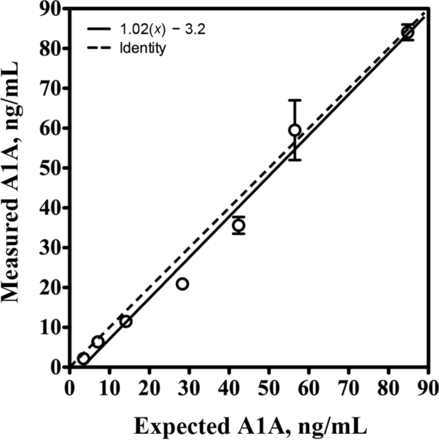
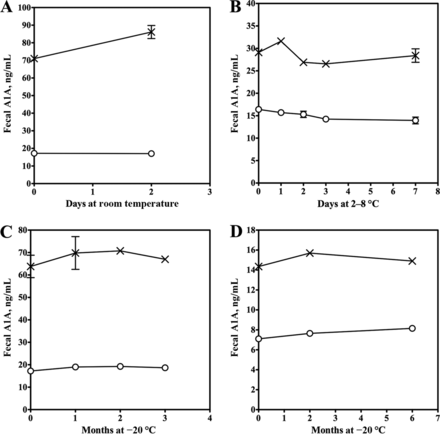
Assay imprecision data are summarized in Table 1. Total imprecision was 6.5% and 14.5% at 17.3 and 66.9 ng/mL, respectively, and both were within the allowable imprecision limit of ≤15%. The LoB was calculated at 0.12 ng/mL. The CV from 23 replicates of a stool extract with a mean (SD) A1A concentration of 2.0 (0.05) ng/mL was 2.5%, so this concentration was identified as the limit of quantification. The assay was linear to 85 ng/mL (1.06 mg/g) with a regression equation of y = 1.02 × −3.2, r 2 of 0.99 (Fig. 1). Linearity was within the allowable range of 90% compared to the expected value across the measuring range. The mean (SD) recovery of A1A added to stool extracts was 108.2% (7.8%) (range, 95.2%–118.4%) (Table 2); this result was within the allowable difference of 90%–110%. A1A was stable in stool within prespecified limits for a minimum of 2 days at room temperature, 7 days at 4–8 °C, and 3 months at −20 °C. In stool extracts, A1A was stable for a minimum of 6 months at −20 °C (Fig. 2).
ImmuChrom A1A ELISA imprecision.
| . | . | Level I . | Level II . |
|---|---|---|---|
| Mean A1A, ng/mL | 17.3 | 66.9 | |
| Within-run | SD, ng/mL | 0.9 | 9.2 |
| CV, % | 5.4 | 13.8 | |
| Between-run | SD, ng/mL | 0.6 | 3.0 |
| CV, % | 3.6 | 4.5 | |
| Total | SD, ng/mL | 1.1 | 9.7 |
| CV, % | 6.5 | 14.5 |
| . | . | Level I . | Level II . |
|---|---|---|---|
| Mean A1A, ng/mL | 17.3 | 66.9 | |
| Within-run | SD, ng/mL | 0.9 | 9.2 |
| CV, % | 5.4 | 13.8 | |
| Between-run | SD, ng/mL | 0.6 | 3.0 |
| CV, % | 3.6 | 4.5 | |
| Total | SD, ng/mL | 1.1 | 9.7 |
| CV, % | 6.5 | 14.5 |
Linearity of the ImmuChrom A1A ELISA
Each point represents the mean of duplicate measurements. The error bars represent the SE.
Recovery of A1A from diluted serum added to stool extracts with known A1A concentrations.
| . | A1A, ng . | . | |
|---|---|---|---|
| Sample . | Expected . | Measured . | Recovery, % . |
| 1 | 17.6 | 18.8 | 106.7 |
| 2 | 22.0 | 25.0 | 113.4 |
| 3 | 26.5 | 30.1 | 113.6 |
| 4 | 6.7 | 7.0 | 104.5 |
| 5 | 8.9 | 9.3 | 104.1 |
| 6 | 13.4 | 14.9 | 111.2 |
| 7 | 13.5 | 14.6 | 107.9 |
| 8 | 17.9 | 19.0 | 105.7 |
| 9 | 22.4 | 22.2 | 99.3 |
| 10 | 40.7 | 38.7 | 95.2 |
| 11 | 45.1 | 50.8 | 112.5 |
| 12 | 54.0 | 63.9 | 118.4 |
| Mean (SD) | 108.2 (7.8) | ||
A1A stability in stool at room temperature (A), 2–8 °C (B), and −20 °C (C) and in stool extracts at −20 °C (D)
The symbols represent the two different stool aliquots with different A1A concentrations and the error bars represent the SE.
A1A reference intervals
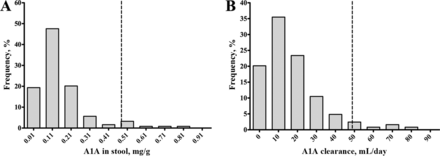
Nonparametric analysis of stool A1A in 124 healthy volunteers generated an upper 95th percentile reference limit of 0.48 mg/g (95% CI, 0.37–0.67 mg/g; Fig. 3A). There were no significant differences in A1A concentrations between sex (P = 0.65), and there was no significant correlation between A1A concentration and age (Spearman r = 0.13; P = 0.16). In the same cohort, the upper reference limit of A1A clearance was 49 mL/day (95% CI, 36–73 mL/day; Fig. 3B). As with the stool reference limit, differences in A1A clearance were not significant between sexes (P = 0.39), and clearance was not correlated with age (Spearman r = −0.06; P = 0.16). The correlation between A1A concentration and clearance was poor (Spearman r = 0.57; P < 0.0001).
Frequency distributions of A1A in stool (A) and A1A clearance (B)
The dashed lines represent the reference limits of 0.48 mg/g and 49 mL/day for A and B, respectively (n = 124).
Discussion
Protein-losing enteropathies are characterized by an excessive loss of serum proteins into the gastrointestinal tract. Once in the tract, most plasma proteins are rapidly degraded into amino acids and reabsorbed. A1A, however, is resistant to proteolysis and is neither secreted nor absorbed by the gut. As such, its measurement in stool serves as a sensitive marker of the disorder (2–4). While some have proposed that a diagnosis of PLE can be aided by measuring A1A in a random stool sample (11, 12), other have argued that A1A clearance testing is preferred (7–10). It is recognized that collecting a timed stool sample can present an obstacle for some patients, particularly pediatric populations, which is why measurement of the A1A concentration in a random stool is frequently used as an alternative for PLE assessment. As demonstrated here, the correlation between clearance and concentration is poor, a finding that has been reported by others (13). Thus, despite the potential difficulties in obtaining a timed sample, it is important for determining a reliable measure enteric protein loss.
Most commercially available methods used to measure A1A are immunoturbidimetric and are optimized to quantify the relatively high serum concentrations. Previously, our laboratory quantified A1A in stool extracts using a modified serum immunodiffusion procedure. However, because A1A concentrations in stool are generally severalfold lower than in serum, this procedure produced highly variable results. For this reason, we evaluated an A1A ELISA for fecal measurements with an expectation of significant improvements.
Our evaluation of the ImmuChrom A1A ELISA found the performance characteristics acceptable for clinical testing. Considering the LoB of 0.02 mg/g and the linearity up to 1.06 mg/g, the established upper reference limit of 0.48 mg/g is positioned well within the analytical measurement range for differentiating normal from abnormal stool A1A concentrations. All imprecision estimates were within the allowable imprecision limit of ≤15%. Assay imprecision was slightly greater at a higher concentration of A1A, which was likely a function of the deliberate use of separate stool samples to evaluate the imprecision introduced by the sample extraction. While the mean recovery of 108% was significantly different from 100% (P < 0.0001), it was within the allowable difference of 90%–110%. Data regarding analyte stability was acceptable and consistent with those reported by others (14).
The combination of an ELISA for quantifying A1A in stool and a well-established serum A1A assay permits calculation of A1A clearance with confidence. Samples from 124 healthy adult individuals were used to establish reference limits of 0.48 mg/g and 49 mL/day for A1A in stool and A1A clearance, respectively. The upper reference limit of stool A1A claimed by the assay manufacturer was 0.26 mg/g and was determined from 78 apparently healthy German individuals. The difference between it and the upper limit identified by the present study is likely a function of both the number of individuals included and population differences. Importantly, it must be mentioned that the unique combinations of stool and serum A1A methods may influence the A1A clearance reference interval and the interval reported in this study may not be directly applicable to other investigations.
In conclusion, the ImmuChrom human A1A ELISA demonstrates acceptable performance characteristics for quantifying A1A in stool extracts. Furthermore, this stool ELISA may be used in combination with the Roche Diagnostics Tina-Quant A1A serum assay to assess A1A clearance for diagnosing and monitoring PLE.
4 Nonstandard abbreviations
Author Contributions: All authors confirmed they have contributed to the intellectual content of this paper and have met the following 4 requirements: (a) significant contributions to the conception and design, acquisition of data, or analysis and interpretation of data; (b) drafting or revising the article for intellectual content; (c) final approval of the published article; and (d) agreement to be accountable for all aspects of the article thus ensuring that questions related to the accuracy or integrity of any part of the article are appropriately investigated and resolved.
Authors' Disclosures or Potential Conflicts of Interest: Upon manuscript submission, all authors completed the author disclosure form.
Employment or Leadership: J.A. Erickson and R.A. Jensen, ARUP Laboratories.
Consultant or Advisory Role: None declared.
Stock Ownership: None declared.
Honoraria: None declared.
Research Funding: None declared.
Expert Testimony: None declared.
Patents: None declared.
Role of Sponsor: The funding organizations played no role in the design of study, choice of enrolled patients, review and interpretation of data, and final approval of manuscript.
Acknowledgments
The authors thank Sara Wyness for assistance in obtaining serum A1A measurements and Kisha Diamse for volunteer recruitment and sample management.
References


